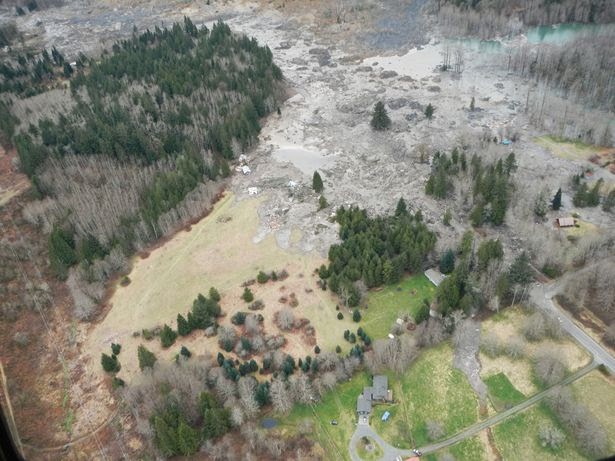
Showing posts with label Stilliguamish/Oso Landslide. Show all posts

Wednesday, September 18, 2019

Toppenish Ridge Landslide near Mabton

Highway 97 south of Toppenish provides a nice view of a large landslide at the east end of Toppenish Ridge.   


Toppenish Ridge is underlain by Columbia River Basalt Group, specifically the Elephant Mountain Member - one of the younger lava flows of the CRBG. Toppenish Ridge is one of several folds of the Yakima Fold Belt that has rumpled the lava flows of the CRBG. There are multiple landslide complexes on the steep slopes of these ridges as a result of the fractured basalt lava with weak sedimentary units in between the lava flows.

Most of the slides are relatively old. By relative, the general sense is that they may have taken place during or shortly after ice age floods impacted the area. As such the edges of many of these slides  has softened with time and weathering. But also with time and weathering and erosion, some of these steep ridge slopes will become weaker and will fail. I do not know if anyone has taken a try at dating this landslide, but is appears much younger with sharp scarps still intact throughout the slide complex. 

Bare earth lidar imagery of slide

The lidar imagery is pretty classic and shows the slide deposit extending over the flood plain of Toppenish Creek and covering over flood overflow channels. The creek has yet to begin any erosion on the slide deposit - another factor in the case of the slide being a young slide. Also note in the lidar imagery that the eastern portion of the slide has only partially moved down the slope and that there is a gravel quarry excavation right at the base of this slope that has removed a portion of the slide deposit.

This slide got some brief media attention when the landslide at Union Gap initiated a couple of years ago. The conditions are similar with basalt overlying weak sediments. The slide is dissimilar in that this one appears steeper. 

Tuesday, October 11, 2016

A Short Note on the Oso landslide Settlement

I have been quiet on the subject of the Hazel/Oso Landslide as I had been retained to help the attorneys representing some of the families. The settlement of the case (50m-settlement-reached-in-oso-landslide-suit and timberland company for $10 million) came as a bit of last minute thing; the jury had been selected and the trial was to start this week.

My thoughts are with the families. While articulating the geologic perspective of this landslide, I was consistently reminded of those that were killed and hurt and their families and loved ones.

I worked with Emily Brubaker Harris and Guy Michelson of Corr Cronin Michelson Baumgardner Fogg & Moore. They and legal assistants were great to work with. Their level of effort and passion and attention to detail was remarkable.     

Friday, October 9, 2015

Basalt Landslides south of Wenatchee

Last Spring I was south of Wenatchee along the Columbia River and got a good view of several very large landslides that had come off the high basalt slopes above the valley.

Large slide complex off of Badger Mountain
The terrace in the left foreground is the Pangborn Bar from an ice-age flood
The vertical relief of the slide is almost 2,000 feet

Slide and rock fall off of Jumpoff Ridge southwest of the Columbia

Another slide off of Jumpoff Ridge


The two Jumpoff Ridge slides viewed from a bit further away
The vertical relief of these slides is a bit shy of 2,000 feet 

The area below Jumpoff Ridge is a huge landslide complex of sliding blocks. The slide complex is too big to take in and is the largest in Washington State. The slide complex extends all the way to the top of the high ridge. 

The headwall of the slide area up on the snowy slopes 

Waitt (1982, Wenatchee Geology Map) describes the slide complex and noted that it predates the ice-age flood deposits. But he also described large translational intact blocks on the upper slide area suggesting post ice age slope movement.  

Monday, December 15, 2014

SR 530 (Hazel/Oso) Landslide Commission Report

Washington State Governor Jay Inslee set up a landslide commission to review the Hazel/Oso Landslide. The commission report came out on December 15: SR530 Landslide Commission Final Report.pdf
 
One of the recommendations is to further fund landslide hazard mapping, "The SR 530 Landslide highlights the need to incorporate landslide hazard, risk, and vulnerability assessments into land-use planning, and to expand and refine geologic and geohazard mapping throughout the State. The lack of current, high-quality data seriously hampers efforts under the Growth Management Act".
 
The Washington State Department of Natural Resources has already developed a robust budget request for funding mapping efforts that will be submitted to the legislators this winter. It is a tough budget year. Where landslide risk and costs associated with it fall will remain to be seen.  

Wednesday, July 23, 2014

GEER Report on OSO Landslide is Out

The GEER report on the Oso slide has been released.

http://www.geerassociation.org/GEER_Post%20EQ%20Reports/Oso_WA_2014/index.html

GEER stands for Geotechnical Extreme Events Reconnaissance. I believe this is the first landslide the program has looked at. They visit sites shortly after huge floods, tsunamis and earthquakes to gather evidence of the event before it weathers away. I utilized a GEER report for assessing scour potential from tsunami in a tsunami inundation area.

Wednesday, June 18, 2014

Emergeny Management Official: Sometimes Massive Mudslides "Just Happen"

"That community did feel safe and they fully understood the risk...."

"Sometimes events that nobody sees just happen"

What I would like to hear: We need to do better.


Monday, April 14, 2014

Perspective on Rain and Oso/Hazel Landslide

Rain gets a bum wrap when it comes to landslides. Heavy rain caused the landslide is a common statement. Record breaking rain caused landslide or landslides. Yes, there is a correlation of when landslides happen and rain events, but you can not blame the rain for making steep mountain slopes, steep shoreline bluffs or steep river valley bluffs. The blame the rain gets added to by forestry types as well. Any suggestion that a landslide was caused by logging leads to finger pointing at rain.

Rain has taken a fair bit of blame for the Oso/Hazel Landslide. And much as been made of record breaking rain. So it was time to check those rain fall records.

The two stations with long term records are Arlington and Darrington. Oso is located roughly half way between these two stations. Darrington has records going back to 1911 and Arlington's goes back to 1922. Finney Creek is a remote station with too short of a record to be much use for comparison. Darrington being more deeply in the mountains is far wetter - roughly twice as wet as Arlington.

Darrington:

The 19.30 inches of rain for March 2014 was the wettest March ever. The mean for March is 8.61. So headlines are record rain causes landslide. Twice normal rainfall triggers landslide. However, slow down and look at some other months. Like January 1953 when 31.22 inches fell. Or the infamous winter of 1933 when 30.42 inches fell in December. All in all the March record has been exceeded in other months at Darrington 17 times. 

Arlington:

The March 2014 rainfall of 8.70 inches at Arlington fell short of the March record of 9.23 inches. The March 2014 rainfall amount has been exceeded 20 times in other months.  

Saturday, April 5, 2014

Age Relations of Nearby Oso Landslide Deposits

Ralph Haugerud put to together a relative age map of some of the older landslides near the recent Oso/Hazel/Steelhead Landslide using LiDAR and cross-cutting relationships and smoothing (softening) of terrain.  
 
Preliminary Interpretation of Pre-2014 Landslide Deposits in the Vicinity of Oso, Washington

Note his B age assignment to the very large landslide deposit I noted on a previous post aerial-history-and-lidar-of-stilliguamish-blocking-landslide. Besides the fact that the slide to the west of the Hazel slide is so large, note that it has thus far only been modestly eroded by the river since it was deposited suggesting a relatively young age.

Tom Schroeder sent me a mark up of witness trees from a Government Land Office survey done in 1890. These surveys provide a bit of a view of the past landscape.

Witness-tree listings from GLO survey, mid October 1890

a. line tree: redcedar 24"
b. line tree: hemlock 36"
c. quarter-corner witness trees: bearberry 10"; vine maple 5"
d. line tree: redcedar 60"
e. section corner witness trees: Douglas-fir 60"; Douglas-fir 72"; Douglas-fir 60"; hemlock 16"
f. line tree: hemlock 30"
g. line tree: hemlock 24"
h. steep bluff
i. quarter-corner witness trees: hemlock 9"; hemlock 5"
j. section corner witness trees: redcedar 18"; hemlock 16"; hemlock 5"; hemlock 15"
k. line tree: redcedar 80"
l. quarter-corner witness trees: spruce 36"; maple 24"
m. line tree: Douglas-fir 70"
n. line tree: redcedar 80"
o. line tree: redcedar 48"
p. section corner WT: hemlock 30"; hemlock 12"; redcedar 36"; maple 16"
q. quarter-corner WT: maple 7"; maple 30"
r. line tree: redcedar 30"
s. section corner: red alder 7"; red alder 6" (only 2 WT because very near left bank of river)

Perhaps nothing particularly definitive, but no huge trees on the slide deposit proper in the survey suggesting that this is not a very ancient feature. Of course there could be other reasons there are no huge trees. Some ground work looking for big stumps may provide some further clues or grabbing buried wood for carbon dates under the slide deposit along the incised river bank if it they can be found.

The take away for this area is that it is geologically dynamic and if a few landslide dates can be added the frequency of these dynamic events may be better ascertained.

Thursday, April 3, 2014

Oso/Hazel/Steelhead: Foreseeable

Dave Petley asks a fundamental and very important question regarding the Oso/Hazel/Steelhead landslide Could it have been foreseen? I fully agree with his conclusion. And I will add the answer to his question is very important.

The LiDAR imagery makes that conclusion relatively easy to reach. However, even before LiDAR was available for this area, previous geologic mapping done without LiDAR had mapped out the large landslide deposits from the landslide area just to the west of the Hazel Slide.

Part of the Sauk 1:100,000 Geologic Map (2002)

The landslide hazard at this location was foreseen by Dan Miller dr-millers-oso-hazel-landslide-reports and Tracy Drury usace.army.mil/Portals/27/docs/civilworks/projects/SteelheadHavenLandslideDraft.pdf. and I suspect a few other geologist that had worked in the area. This landslide and the hazard it posed was foreseen. The Hazel/Steelhead landslide had been actively moving on and off for many years. Analysis of the slope had indicated large run out distances. The risk that the slide would expand was raised. The LiDAR images as well as the previous published mapping indicated that landslide run outs from failures of the same units from very nearby had run outs that crossed the entire valley floor. That is the LiDAR that Dr. Petley used as an obvious indicator.

Rereading the Miller and Sias paper as well as other reports by Miller and a report by Drury is digging into the early stages of a disaster and watching it unfold. In a report on the slide Miller did in 1999 he provided an analysis of the then active landslide area and potential run out distance that was very close to the slide run out that took place in 2006. But he as well as Drury both stated concern about the slide area expanding and Miller noted that if the slide expanded to include a previous old slide block the results would be an order of magnitude greater. That is 10x greater in science geek lingo.

The papers and reports by Miller and Drury are the ones I know of. But I also have known a number of geologists and scientists that were familiar with this site and they all expressed grave concerns to me. Especially after the large slide in 2006. It is why that I knew as soon as I heard the news of a river blocking slide that it was this slide. It took me 5 minutes to put up the first post I did on the slide HERE.

The 2006 slide and the slide movements after lowered the support for the very high and very unstable slope above. It was just a matter of time and the threshold of the disaster would be crossed. Predicting when that threshold would be crossed is not something we can do, but this disaster was clearly close at hand. It was not some "oh way off in the future" event. To say otherwise would be irresponsible.

Understanding this from a hazard management perspective is very important. If the landslide could be foreseen and indeed was foreseen, this slide does have policy implications that we should learn from. Yes, geologic disasters do happen that may humble us because we can not predict accurately when or how severe, but in the case of this landslide geologists had a very good idea this was a bad landslide that posed a significant threat. The problem is not with the science, but with policy. 

Tuesday, March 25, 2014

Seismic Signal From Oso/Hazel Landslide

Liem alerted me to the local seismic network and sent the Mach 22 seismic plot from the Jim Creek Station. A seismic signal was also recorded at the Cultus Station and Stanwood Station. 
 
Seismic network from the Pacific Northwest Seismic Network
(Stanwood seems a bit far from Stanwood proper)

Jim Creek

Cultus Mountain

Stanwood

All three stations record two events at approximately the same time and at the same time that the landslide event was reported to have happened. If this signal is from the slide, it indicates that two separate events took place a few minutes apart.

I checked other stations a bit further afield and found no signal, further suggesting that the slide was the source of the seismic signal.

Monday, March 24, 2014

Stilliguamish Flowing again at Arlington

I am sure some clever hydrologists are estimating the volume of water that has been held back by the landslide. Based on the graph of the discharge at Arlington it appears the river was backed up for approximately 30 hours so I came up with 2,727 acre feet. 


The good news it that it sounds like the river is finding a new path and the held back water will draw down in a steady manner, but will require the river to erode downward. Given the loose material and distance it was deposited over, I am optimistic there will not be a huge flood surge. The communities and public safety and public workers on the Stilly need a break. Weather wise things look not too bad either with weather models indicate the organized storm tracks will be well to the south.  

Sunday, March 23, 2014

Aerial History and LiDAR of the Stilliguamish Blocking Landslide

Aerial and LiDAR images explain a great deal about the landslide that blocked the NF Stilly (geology-of-silliguamish-blocking-slide and arm-waving-notes-on-stilliguamish). The LiDAR particularly shows the extent of past sliding and the scale of the past landslides. This leads to policy issues, but I will save that for a later day or two or week. 
 
This first image is from 1989. I marked in red the river route in 1989 as well as outlined the slide activity at that time. Obviously the river is eroding the base of the steep slope setting up an unstable situation and the ground is starting to unravel. Note the relatively new clear cut harvest. There have been and is ongoing debate regarding clear cut harvest and water infiltration into deep-seated glacial sediments in part triggered by this slide but also another set of slides in deep steep canyons elsewhere nearby. In this case, I will offer an opinion that the river erosion at the toe is the big driver of slope instability.


This image is from 2003. As can be seen the river and slide area has shifted a bit westward. This image is before the slide that took place in 2006 that blocked the river channel in a very similar manner to the Nooksack River blocking event of 2014.

This image is from 2006, post river channel blocking slide. The river has a new channel as it was deflected southeast by the mass of slide material. Note how much the slide has expanded westward. What can not be seen is that the west slope of the slide is much higher in elevation and thus contains a lot more volume. The new channel was partially excavated and rock lined by the Army Corps of Engineers to maintain flow away from the landslide toe area. Also note how much the river had been pushed towards Steelhead Drive.


 This image is from 2009 and shows the slide area is greening up except for the steep headwall scarp on the west limb of the slide. Note as well the straight line edge of the river channel on the slide side of the river. The channel has become wider than the 2006 channel due to erosion and the straight edge river bank is an engineering effort to contain the northwest directed erosion.

This image is also from 2006 and shows active stream channel work taking place. I am not entirely up on the project, but it was part of mix of salmon recovery and hazard management work conservationregistry.org/projects.

The 2013 image shows that the main body of the slide has greened up more. But note the headwall on the west side is still bare in part because it is so steep. However, part of the bare ground is the result of headwall collapses dumping material onto the unstable slide mass - not a good thing and it is what I observed when I took a look at this slide last summer. It was still active and clearly not done.

LiDAR is a great tool for assessing landslides. The bare earth images have made mapping large landslides and large landslide deposits an office exercise with focused field trips. The active slide area is easy to see, but there is so much more to be gleaned from the LiDAR in regards to scale.

This first image marks the active slide area at the time of the LiDAR in red. Blue arrows indicate the river flow. The orange line marks the boundary of an older headwall scarp. The area between the red line and orange line had not been actively sliding over the past 20 plus years, but that scarp indicates that some time in the past that area was likely part of a big landslide. Based on the Seattle Times images, I suspect that this area between the red and orange lines may have collapsed and the pre existing deep-seated slide may have expanded. This area between the red and orange lines and just where the new headwall scarp is located is my main interest as the pre failure and post failure geometry may provide some geology slope stability lessons. A hard and costly lesson.

This next LiDAR image pulls back away a bit to show the bigger picture of the slope stability of the area.
The smallish red marked area on the right is my estimate of the active slide area. I did not include the deposition area of the slide as I don't have a good image yet, but can say that the deposit extended clear across SR530 on the map.

The larger red outlined area in the central portion of the image is from a much larger slide. The deposit area from that slide was even bigger than what is indicated, but the southern end has been eroded and removed by the river. It would be very interesting to know how old this slide is. And also might be informative to look at the geometry of the headwall area.

Geology of Stilliguamish Blocking Slide

This post is more on the lines of what is known about the geology of the slide area. This landslide area is well known and has been a big problem for the past roughly 20 years. This was very much like the Ledgewood Slide on Whidbey Island. When I heard about a blocking slide on the Stilly, I had two candidate locations in mind and this was the first one. I say this not to brag, but to emphasize that this particular slide is well known amongst geologists as well as fisheries and forestry policy wonks. I do not do much work in the Stilly, but last summer had some work near here and took a little side trip to check it out. My thought at the time was "Yikes, this is a bad slide."

                               Geologic Map of the Sauk 1:100,000 Quadrangle.pdf

The above map shows the larger scale geologic features of the landslide area that blocked the Stilliguamish. Ql on the map noted by the yellow area with red dots are landslides. As can be seen there are a number of areas designated as landslides. A word of caution though. Not all landslide designations are the same and there is a bit of inconsistency on maps including this one. This is a 1:100,000 scale map so there is a lot of detail that can not be presented. That is true of the landslide units as well as other units on the map. This map is a big picture map that is a compilation of decades of work by many different geologists. Part of the Sauk map utilizes mapping I did in 1990 miles from this location. The area I mapped covered 150 square miles - I guarantee there was a lot of detail I did not cover, but even some of the detail I had on my map could not be included at the sale of this map sheet. 

The geologic unit that is within the landslide area is mapped as Qvr (mustard green?). Qvr stands for Vashon recessional sediments. These sediments were deposited during the late stages of the last glacial period. During the late stages of the ice age the valley was filled with glacial derived meltwater sediment. River gradients were different at that time due to higher local sea level as result of the mass of the Puget ice lobe having pushed the crust downward. As the land rebounded the river gradients became steeper and the river incised down through the former valley fill creating steep side slopes in unconsolidated sediment - a recipe for landslides. That is particularly true when the river is hard up against the base of the steep slope as was the case at this recent big slide (and on the recent slide on the Nooksack).

I should add that one of the interesting features of the North Fork of the Stilly is that this valley was for a time occupied by the Sauk River (glacier-peak-and-sauk-stiiliguamsih).

A more detailed map of the slide area was completed by Dragovich and others (2003)


This map also shows extensive landslide areas. On this map the designation is Qls. The current slide is just part of a larger area along the valley that has indications of landslides.

If you click and enlarge the image, there are designations of units within the recent slide. The map indicates the slope is underlain by advance glacial lake sediments (Qgle). These sediments were deposited when the outlet to the valley was blocked by the advancing ice in the Puget Ice lobe that dammed the river forming a lake. The next unit up the slope is Qgtv. This is glacial till and was deposited directly by glacial ice when he ice advanced up the valley and covered the area approximately 16,000 years ago. Both of these units will be very hard and compact due to the mass of glacial ice that had compacted them. But the real trouble is from the units above these. As the glacial ice receded, a new lake formed by the blocking ice and a recessional glacial lake formed (Qgle). This unit was never compacted and on top that unit is a sandy layer. Picture the valley being filled clear across by these units and the floor of the valley being a couple or three hundred feet higher than it is today. The river (first the Sauk and NF Stilly combined and then latter just the NF Stilly) down cut and incised through these sediments. These two late glacial units are particularly susceptible to slope failures and have failed on multiple occasions at this location (https://slidingthought/north-fork-of-stillaguamish/ and http://www.stillaguamish.nsn.us/steelhead%20haven%20slide.htm) as well as elsewhere along the sides of the NF Stilly valley. 

A final note. The work done on the 2003 map by Dragovich and others with the Washington State Department of Natural Resources is the kind of basic research that is so informative. The mapping program at the DNR has been outstanding and has been funded by both State and Federal funding. This kind of mapping is enormously important. How it is translated to public benefit is another matter.

Saturday, March 22, 2014

Arm Waving Notes on the Stilliguamish Blocking Landslide

Saturday morning a large pre existing landslide let loose on the Stilliguamish River. This slide has caused trouble before, but this time it has proven to be fatal with three killed and several injured. This failure was at a much larger scale than previous events and has blocked the river. This blockage is much more serious than the recent short duration blockage on the Nooksack River a few weeks ago. Strongly worded evacuation orders have been issued for downstream residents.
 
Image of landslide viewed from the south looking north up from the Stilliguamish Valley
(photo, Snohomish County)

View of landslide deposit (Snohomish County)
View is from the north looking south down to the valley floor
State highway is buried along the lower edge of thick patch of trees
The pooled water of the Stilliguamish River can be seen on left 
The river flow is from left to right

Landslide deposit (Snohomish County)
View is from the east looking west down the valley just upstream of the slide
Highway can be seen on lower right.
Brown strip on left is he electric power transmission line corridor
It appears that the river is pooling and beginning to flood areas beyond the slide area. 

Google earth image of landslide area
I marked the outer edge of part of the slide deposit from the Snohomish County photos. 

AERIAL VIEW

Seattle Times has some excellent perspective pictures: http://seattletimes.com/html/photogalleries/localnews2023201892/

I'll likely have more later. This slide will be well covered by the news and I am sure a variety of agency folks will provide some good rapid response assessments. I'll add some bits as I see appropriate.

What I will add now though:

1) News coverage is a bit odd as news helicopters from news stations in Washington State have been grounded due to a news helicopter accident.

2) People really should be forced to evacuate under these conditions. A river dam burst flood is not something you want to be in. Life is more important than possessions.

3) This slide was a preexisting problem. There was concern that it would block the river a few years ago. Landslide wonks knew exactly where this slide was as soon as it made the news. I looked at this slide area last summer. It was clearly bad news then and with very heavy multiple rain events the past six weeks landslides - particularly big ones are not a surprise.