Showing posts with label weather. Show all posts

Saturday, January 13, 2024

Another Icy Bay - Alice Bay

I enjoy our periodic short burst of true winter weather. The cold periods in western Washington are short. I will say that while the areas subject to Fraser River outflow winds are a bit rough - 50 mph winds when the temperature in the teens and single digit range is not pleasant. 

The north edge of Skagit delta does get cold due to the proximity of the Fraser Canyon winds coming down across Whatcom County and over Bellingham and Samish Bay. The delta is generally a windy place, but Samish Island deflects the north wind such that the south side of the island is cold but not windy. 

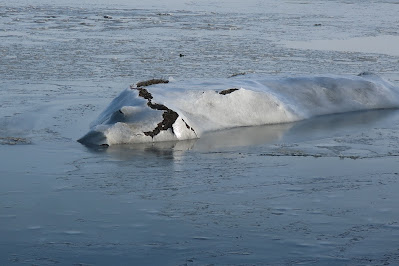
Alice Bay, a bay that is separated from Samish Bay by a low peninsula of salt water marsh was completely frozen over. Alice Bay usually completely empties of water during low tides; hence, the shallow water during high tides freezes.  

Alice Bay with Scott Point on the near left and Blanchard Mountain behind,
snowy Anderson Mountain on center left and Lyman Hill the ridge on the center right. 
Note the odd naming of Lyman Hill. The 'hill' is 800 feet higher than Anderson Mountain and 2,000 feet higher than Blanchard Mountain.

The tide range is on the order of 11 feet and therefore the ice layer has to rise and fall with the tide. The high tides cover the salt marsh during king tides and the shallow water over the marsh froze. 

Tidewater on the salt marsh. Elevated ground on the right is a dike that blocks the tide water from farm fields and a road. 

Island of salt marsh draped with ice.

Dike with sand bags. The tide water overtopped this section of dike last winter during a storm surge (Here).

Friday, January 12, 2024

Icy Padilla Bay

This winter has been very mild with no hard freezes until last night. Not sure of the local low at Padilla Bay, but it was somewhere in the vicinity of 6 F. The bay is shallow with broad tide flats that extend about a mile from the beach. The shallow sea water froze. It was a chilly night for the locals on the north shore of the bay as power was out most of the night.      


Sunday, December 3, 2023

King Tides, Storm Surge and Field Work

We are in king tide season. King tides are the higher high tides of the year and winter is when the tides are the highest. The moon is the bigger driver of tides, but the sun is critical in the seasonal variability of tides that result in the highest tides of the year.

The earth is closest to the sun on about January 3 and hence the pull of the sun on the earth tides is greatest on that day. However, the tilt of the earth relative to the earth's orbit results in the Washington coast dipping downward into the maximum tide zone during the winter solstice. Hence, our highest astronomical tides take place in the December/January period.    

Declination and tides from Hicks (2006). 

In the above figure Washington State is approximately at the C-D line. The result is that when we are at position C we are in the king tide zone. 

Other Factors

Storm Surge:  The astronomical tide is impacted by meteorological forcing. A deep low pressure system will result in a higher tide level than the astronomical tide. The wind around the deep low pressure also results in water being piled up against the coast depending on the track of the low pressure. The track of a hurricane center is a very important component of the storm surge associated with hurricanes. The low pressure of the hurricane will result in storm surge but so does the wind. Being on the right hand side of an approaching hurricane (from the hurricane's view) can result in huge storm surges.

The same issue holds true for the Washington State coast. Deep low pressure systems bring lots of wind that will push and pile water up at different locations depending on the track of the low and the wind fields around the low. The impact of deep low pressure storms and associated wind fields on the inland waters of the Salish Sea is complex due to the shape of the multiple waterways. Yang and others (2019) modeled storm surge in the Salish Sea and provide an estimated maximum storm surge map for the Salish Sea.

Figure 12 from Yang and others (2019)

A large storm surge December 27, 2022 resulted in significant shoreline flooding as the storm surge coincided with an already high astronomical high tide event. 

Water overtopping shoreline dike at Alice Bay, Skagit County
(note center road stripe under water) 

Water overtopping shoreline dike at Alice Bay
(note white fog line road stripe under water)

18.61-year lunar nodal cycle: The plane of the orbit of the moon is inclined 5.145° from the equator. The result is that the moon's pull on the tide varies. When the moon is above the equatorial plane the pull is larger. We are currently in a period when the moon is more frequently above the equatorial plane during the king tide period. The result is more frequent tides being extra high this year as well as next and therefore the odds of a very high astronomical tide coinciding with a storm surge are greater this year and next than on average.   

Timing of winter high tides

The tides set the waters of the ocean basins into motion. This moving water pushes up or pulls away continents and up into the inlets like such as the Salish Sea. The actual response of the ocean basins and estuaries to tides is complicated and can lead to some pretty remarkable tides. I recall walking out on a dock in the Bay of Fundy with a 2 year old and being terrified of the potential fall hazard with boats 50 feet below us during low tide. Hicks (2006) provides a good overview of the factors that impact estuary tide levels.  

A peculiar feature of tide interactions in the Salish Sea area I work along most frequently is the lack of low tide during the day light hours of winter. Assessments of shoreline bluffs in mid winter can be complicated by the tides as the plot below shows.

High tide was at about 8 in the morning, but the low tide at noon is not exactly low with second high tide coming in at 3:15 in the afternoon. The main low tide was really low - a negative tide at around midnight. Clam digging or oyster harvest at night in the winter. 

I had a bit of hike to reach the shoreline bluff I needed to visit as there was no access down the very steep and high bluff for a few miles in both directions. I know this shore reach well enough that I figured I could make the 8 mile round trip hike with only the need for limited wading where the beach was narrow. With sunset at 4 the best I was going to get was a tide of about 8 feet. Note that there was minimal storm surge and the other plus was it was a calm day with no ocean swell coming in the strait.  I started the hike after noon. The deepest wade was only shin deep and the waves were minimal. The water was warmer than the steady rain as the air temperature was 38 degrees. 

House lights atop a high bluff above the Salish Sea

I took the above picture while heading back from my venture. I had to hold the camera against a log due to the darkness. The warm glow of the house lights struck me as a nice touch. I still had two miles to go to reach my car.  

While I think most folks would consider that venture just awful, I was completely content. I had reached my destination, figured out the landslide complex and shoreline processes adequately, gotten a good hike in and timed the trip so it could be done. The satisfaction of field work!  

Monday, November 15, 2021

Notes on Skagit and Nooksack Flood Levels

An atmospheric river  has been aimed at northwest Washington over the past few days and the rain continues today. A look at river level gages and predictions indicates some serious river flooding. But note too that many small streams have no flow gauges or predicted flood crests will flood as well.

The Skagit River has reached flood stage , but the current predicted flood crest at Mount Vernon will not arrive until tomorrow. The Skagit is a large river watershed and the peak flows take a while to get down to the delta area. Projections are for record flood levels at Mount Vernon.    

The much smaller Samish River also flows out onto the Skagit delta will peak faster with a record peak today. 


Both of these rivers flow out across broad low delta areas with portions of the deltas diked from tidal flooding. The Skagit has very large levees through Mount Vernon. But some over topping may take place. The Samish also has levees, but they will very likely be over topped. Once the delta floods the drainage out of the delta is restricted by the tidal levees -- all that water that spills out of the rivers then has to flow through drainage systems and tide gates.   

The Nooksack River began flooding yesterday. The Nooksack flooding is complicated. At Ferndale the projection is a moderate flood level. 


However, upstream at Cedarville the projection is potential record flood levels. 


Between Cedarville and Ferndale the river flood waters flood out of the Nooksack and into the Sumas River River (everson-sumas-overflow). Hence, the flood levels at Ferndale is somewhat diminished by water laving the Nooksack and flooding into the Sumas River. The border town of Sumas in the Sumas watershed began flooding yesterday.     

The Nooksack River has three forks that converge above Cedarville. This ads another complication to the Nooksack flooding because the timing of each forks peak discharge makes a big difference in the flooding downstream. There will be major flooding in the South Fork valley. 


Wednesday, August 18, 2021

A Smoke Eclipse from the Schneider Spring Fire

I had a couple of central Washington projects and was relieved that the approaching cool front cleared the smoke away. The western air flow was evident as I approached the Columbia River gorge from the high plains of central Oregon.  

Lenticular clouds formed downwind of Mount Adams

However, the clearing of the stagnant air and smoke does not mean the fires are not still active. The Schneider Springs Fire (HERE) created a huge plume of smoke and cloud.

Plume of smoke and cloud above Schneider Springs Fire viewed from Yakima

In the Yakima Canyon between Selah and Ellensburg the plume of smoke passing overhead eclipsed the sunlight cooling temperatures in the canyon. 

North end of the Yakima Canyon with the Stewart Range in the distance and thick smoke overhead 

Dim evening like light south of Ellensburg

Smoke plume downwind darkening the Wenatchee Mountains

View to the west from Highway 10 northwest of Ellensburg

About half way between Ellensburg and Cle Elum I got back into the sun. 

Smoke plume and wind turbines northwest of Ellensburg

It was nice to have the smoke pass over and not breath it. There was some ash fall of white burnt fir needles while I was working in the Yakima Canyon, but no smoke, no hot sun and temperatures in the mid 80s made the work a lot easier than expected.


Friday, July 9, 2021

Notes on Heatwave Global Warming Attribution

Phillips and others (2021) have taken a rapid assessment run at global warming attribution of the 2021 Pacific Northwest heat event. A summary of key points is provided at the beginning of the paper. Two points stand out:

The observed temperatures were so extreme that they lie far outside the range of historically observed temperatures. This makes it hard to quantify with confidence how rare the event was. In the most realistic statistical analysis the event is estimated to be about a 1 in 1000 year event in today’s climate.

This simply emphasizes what most long-term Pacific Northwest residences felt - this event was very far from what anyone expects for northwest summers. For those that experienced the event, you have a story to tell. But this was more than a remarkable event for the Pacific Northwest; Christopher Burt author of Extreme Weather stated “This is the most anomalous regional extreme heat event to occur anywhere on Earth since temperature records began. Nothing can compare.”   So for those that went through the event (I missed it), you can say you went through a world historic weather event.

There are two possible sources of this extreme jump in peak temperatures. The first is that this is a very low probability event, even in the current climate which already includes about 1.2°C of global warming -- the statistical equivalent of really bad luck, albeit aggravated by climate change. The second option is that nonlinear interactions in the climate have substantially increased the probability of such extreme heat, much beyond the gradual increase in heat extremes that has been observed up to now. We need to investigate the second possibility further, although we note the climate models do not show it. All numbers below assume that the heatwave was a very low probability event that was not caused by new nonlinearities. 

Under the first possible source, that the event was a very low probability event, global warming additive attribution pushes the temperature upward some amount more. Phillips and others (2021) note that the observed annual maximum daily temperatures in the Pacific Northwest trend is approximately 2 times the global temperature trend. So regardless of the event being rare, our heatwave temperatures have been trending upward at a greater rate than the global temperature trend as well as our local temperature trend.

Figure 4 b) Annual maximum of the index series with a 10-yr running mean (green line)

Burt noted in 2017 that Seattle has had 122 record high temperatures since 2010 compared to 19 record low temperatures and Salem has had 98 record highs compared to only 11 record lows.  

Another potential added source of heat is the trend of 500hPa height associated with a warming expanding atmosphere (Christidis and Stott ,2015). 


Phillips and others (2021) also suggest a source of added heat may be from persistent drought in the west leading to higher temperatures.


Given the circulation associated with major heatwaves in the Pacific Northwest, drought and enhanced heating in the southwest will be a contributing factor as hot air from that region descends into the lower elevation areas of eastern Washington and across the Cascades to the west side. 

Phillips and others (2021) suggest that global warming pushed the temperatures about 2°C warmer than they otherwise would have been. 

The other question or cause would be the potential that the heatwave was caused by a 'nonlinear' factor related to global warming. Phillips and others (2021) do not attribute this event to a nonlinear event such as a wavy stalled jet stream, but do give it a brief discussion and suggest further analysis. 'Stuck' jet streams or omega blocks are a point of some debate in climate science. 

I would note that this attribution paper was a bit narrow. John Pollack (HERE) notes that this event was preceded by two western US heatwaves of similar pattern, but to the south in June that set records including tying the all time high temperature in Palm Springs, CA of 123 F. Those events likely provided some additional heat charge to the third high pressure event centered in south British Columbia with southeast flow of air coming up from the southwest U.S into the Pacific Northwest. And the pattern of high pressure heatwaves of long duration is continuing. From the National Weather Service: The current forecast for Las Vegas is just below the all-time record of 117.  This is the fourth western US major/record breaking heatwave in the past month.


Tuesday, July 6, 2021

A Few Notes and Readings on the Heat Wave

I missed the heat event in Washington as I am out of the area. So I have no direct observations about the event. From afar it was really remarkable to follow this event as it developed. The weather models and projections were alarming and I will say it caused a level of concern for friends and family. I will also add that I have spent a fair bit of time in the Fraser River canyon and it is is painful to think about what has happened in Lytton.    

First of all, the weather prediction models were amazing. Models can be useful, but it really is remarkable when the models indicate something that has never happened and is an extremely rare event and the actual event happens as the models indicated.  

Phillippe Papin via twitter.com/pppapin/ lays out the antecedent event in the tropics and how the extreme heat would be generated. Note the post was June 23.  

There were a few statements made during the run up to and after the event that warrant repeating:

From the National Weather Service Seattle Office as the heat event was about to take place:  "As there is no previous occurrence of the event we're experiencing in the local climatological record, it is somewhat disconcerting to have no analogy to work with." --- National Weather Service, Seattle on June 27, 2021. 

This statement from Bob Henson and Jeff Masters clarifies what a big deal this heat event is: "Never in the century-plus history of world weather observation have so many all-time heat records fallen by such a large margin than in the past week’s historic heat wave in western North America. The only heat wave that compares is the great Dust Bowl heat wave of July 1936 in the U.S. Midwest and south-central Canada. But even that cannot compare to what happened in the Northwest U.S. and western Canada over the past week.", Bob Henson and Jeff Masters (worlds-most-extreme-heat-wave-in-modern-history)

Jeff Beradelli (Here) -- "To put climate extremes into perspective we measure against the average. The sigma is the standard deviation of a normal distribution of expected values. In this case the heat dome sigma max is 4.4 - that means it's outside of 99.99% of expected values or a 1/10,000+ chance.

 Bumbaco, Dello and Bond (2013) describe of how most heat waves develop in the Pacific Northwest and that description is consistent with this latest event. They note "Current research suggests that the frequency and duration of heat waves are expected to increase in much of the United States, and analysis of the heat events reveals that a significant, increasing trend in the frequency of the nighttime events is already occurring in the Pacific Northwest. A heat wave occurred in 2009 that set all-time-record maximum temperatures in many locations and ranked as the second strongest daytime event and the longest nighttime event in the record."

This chart shows that since the 2013 above described paper there have been a number of additional heat evets of 20+ above normal, and this event blew way past what took place in 2009.  


The attribution of this event to anthropogenic global warming (AGW) will be analyzed in detail. The attribution of AGW to extreme heat waves has been generally strong (Special Supplement to the Bulletin of the American Meteorological Society Vol. 102, No. 1, January 2021).

Thursday, May 27, 2021

Blowing Dust in Skagit and Douglas Counties

Last week while on the Waterville Plateau in central Washington I observed a bit of a dust storm to the east in the early morning.


Blowing dust on the north side of the Waterville Plateau
Distant haze suggest dust blowing further east 

The dust blow was from an area that burned last September that is also underlain by glacial lake sediments. Glacial ice from the Okanogan ice lobe blocked the Columbia River forming a large ice margin lake. The lake sediments are very fine grained and readily will erode via both water and wind from areas of disturbed ground. 

More surprising was the dust storm mid day today on the Skagit River delta.


April and May have been dry on the Skagit delta/flats and the fields are drier than usual. This is generally a good thing as wet springs can hamper getting out on these fields -- they are just above or at sea level (think Netherlands and dikes that keep the tide out). Most of the dust was from potato fields that were recently plowed. They get plowed pretty deep and pretty late with some not yet planted. However, one corn field just sprouting was kicking up dust as well. The pictures are from between Edison and Allen, northwest of Burlington.


Dust lifting off plowed field obscuring the view of Blanchard Mountain

Dust lifting off field with Bayview Hill in the distance

Driving across the Samish Flats was an eastern Washington experience


The dust blow lasted a few hours but ended as the wind calmed a bit and spring shower passed through. 


I sent a few pictures to Cliff Mass and he has a write up on today's wind event: dust-storms-on-both-sides-of-cascades. Cliff included some pictures from the Tri-City area, a place where I experienced my share of dust storms. 

Josh Ritter starts a song that is apt for dust storms and farming: "Dirt roads and dryland farming might be the death of me. But I can't leave this world behind" Josh Ritter - Lawrence, Kansas. I will just note that all the rain in Skagit winters precludes dirt roads in the farm land.


Thursday, May 20, 2021

Late Low Snow and Rosie Has a New Baby

On Monday I headed to central Washington via the Highway 20 across the North Cascades over Rainy Pass and Washington Pass. A cold rain was falling in the late afternoon as I crossed the passes. The sky cleared by the time I reached the Columbia River at Pateros so I opted for camping at a favorite site that will remain secret. When I got into my sleeping bag it was 63 F -- a bit warm for sleeping, but by morning it was 36 as the cold air caught up to me. 

It was hard to tell as the mountains still have lingering late snow, but it looked like there was fresh snow on the North Cascades in the morning. 

I had to head back Tuesday and noted the fresh snow on the trees and peaks on my return. 

Liberty Bell approaching Washington Pass

View of Fisco Mountain while descending from Washington Pass 

View of high ridge between Colonial Peak and Pyramid Peak on the descent to the Skagit River

 Late Wednesday even Lyman Hill at 4,000 feet in the Northwest Cascades had a dusting of snow on its upper slopes added to the older snow on the clear cuts.


Our neighbor Rosie delivered as least one fawn on Wednesday. Three years ago Rosie somehow got her nose torn up; hence my name for her. She typically has previously had twins so another may be on the way. Our other neighbor, Blackie, has not made an appearance yet, but I expect she will be around with her fawn or fawns soon.


Wednesday, August 26, 2020

DEM of non survivable storm surge

To get a sense of the potential inundation of a non survivable storm surge I set the storm surge at 15 feet for the Louisiana-Texas border region on a DEM map. First image is typical shore,second is with 15 feet inundation. 


Thursday, January 16, 2020

Snow Eater Wind Comes to Northwest Washington

Down slope winds off of mountain ranges can have a pronounced impact on temperature. Long cold spells in central and eastern Washington will come to abrupt ends when storm systems from the west are strong enough to push across the Cascade Range. The descending air will scour out the pool of cold air but also the descending air warms rapidly causing a sharp jump in temperature. The wind is locally called a Chinook and the term is used widely in the interior northwest U.S. out to Montana and the plains of Alberta.

A similar phenomena took place last night in the lowlands of western Washington - only the wind direction was reversed. A low pressure off the coast to the west created a sharp pressure gradient from east to west across the Cascade Range. The result was a sharp temperature increase from the descending air.         


Bellingham temperature plot

In Bellingham the temperature jumped about 20 degrees in minutes. The temperature spike lasted for a few hours and when the descending winds eased, the temperature returned the low 20s.

A similar effect took place in the Skagit lowlands that I experienced first hand. I had to venture out to pick up Lisa at the train station in Mount Vernon. The wind was very hard from the east; high enough to cause some slipping on the icy roads as the car was pushed about, and formed numerous speed bumps of snow drifts. But on the return the temperature jumped from the low 30s to the mid 50s in less than 5 minutes.

The Blackfeet Indians called these events snow eaters. Indeed much of the snow was eaten away down from its deep layer by the warmish and dry wind before the temperature lowered to the 30s and the slow wet melt that has persisted all day. 


Wednesday, January 15, 2020

Snow Day on Samish

A snow shower band stayed in place over a swath of northwest Washington last evening leading to a snow day. Mid day I took a walk-about on the east end of Samish Island. 

Lummi Peak is the high point of Lummi Island to the northwest 

Chuckanut Mountain to the northeast with Samish Bay in the foreground

Blanchard Mountain with Samish Bay in the foreground

On USGS topographic maps Blanchard Mountain is lumped together with Chuckanut Mountian. Locally the term Blanchard Mountain is used for the southern summit area. The name is derived from the small village of Blanchard at the base of the mountain. Geologically the two mountains are markedly different with the northern Chuckanut Mountain underlain by Chuckanut Formation sedimentary rocks of Eocene age. Blanchard is underlain by metamorphic rocks of Jurassic age.

Lyman Hill to the southeast

Lyman Hill is 2,000 feet higher than the highest point on Chuckanut Mountain. Perhaps it seems hill like as to the main portions of the North Cascade Range is further to the east behind the "hill".

Alice Bay viewed from Scott Point at the east end of Samish Isalnd

The road towards home.

The road to Samish Island looking south from the island across the flats

Samish Island is an island that can be driven to. The island was separated from the mainland by tide flats prior to dikes being built to create farm land.
The road heading up onto the island

It was sort of a black and white day - mot much color with the snow and overcast. One bright spot was this Ixoreus naevius (varied thrush) on a small native cherry in the forest.